
From Spreadsheets to Visibility: Dashboards for In-House Legal Teams
Managing multiple matters, deadlines and team responsibilities can at times feel like juggling without a net. In-house legal leaders already have all the necessary inputs: matters, deadlines, risks and workload, yet much of it lives in spreadsheets or in team members’ memories. Even if your team is already tracking data, inconsistent or fragmented approaches can make it hard to track urgent tasks, delays and team capacity.
This is where dashboards come in. They act as an in-house legal team’s day-to-day compass, providing clarity and supporting better decision making. By tracking operational metrics such as matter status, workload and bottlenecks, dashboards shift legal from reactive tracking to forward-looking control.
Why Operational Metrics Matter
Not all metrics are created equal. Broadly, they fall into two categories:
Operational metrics: These give a real-time view of what needs immediate attention, highlight bottlenecks and visibility of team capacity is being used across the team. These metrics support day to day decision making and help work move forward smoothly.
Outcome metrics: These track trends over time, giving insight into efficiency and team performance. Outcome metrics support data-based strategic planning.
Establishing operational metrics first provides a solid foundation before tracking longer-term outcome metrics. The next step is setting up operational dashboards that capture these metrics effectively.
Three Dashboards Every Legal Team Needs
-
Purpose: This dashboard answers a simple but critical question. What is the team working on right now?
Key metrics:
Total number of open matters
Number of matters approaching deadlines
Number of matters waiting on approvals, inputs or external information
Getting started:
Maintain a simple list of all active matters
Track the status, priority and deadlines for each matter
Summarise the data to:
Calculate the total number of open matters
Identify matters approaching deadlines
Highlight items waiting on approvals or external inputs
-
Purpose: Surface high risk matters so issues can be addressed before they escalate.
Key metrics:
Matters flagged as high risk
Getting started:
Clearly flag high-risk matters in your tracker for easy identification
Add categories to capture why a matter is at risk (e.g., delays, resource constraints, missing information)
-
Purpose: Understand ownership, capacity and progress across the team.
Key metrics:
Matters per team member
Status of matters per team member
Getting started:
Assign a clear owner for each matter in your tracker
Group active matters by team member to see work distribution
Highlight which matters are progressing and which are stalled
Bringing It All Together
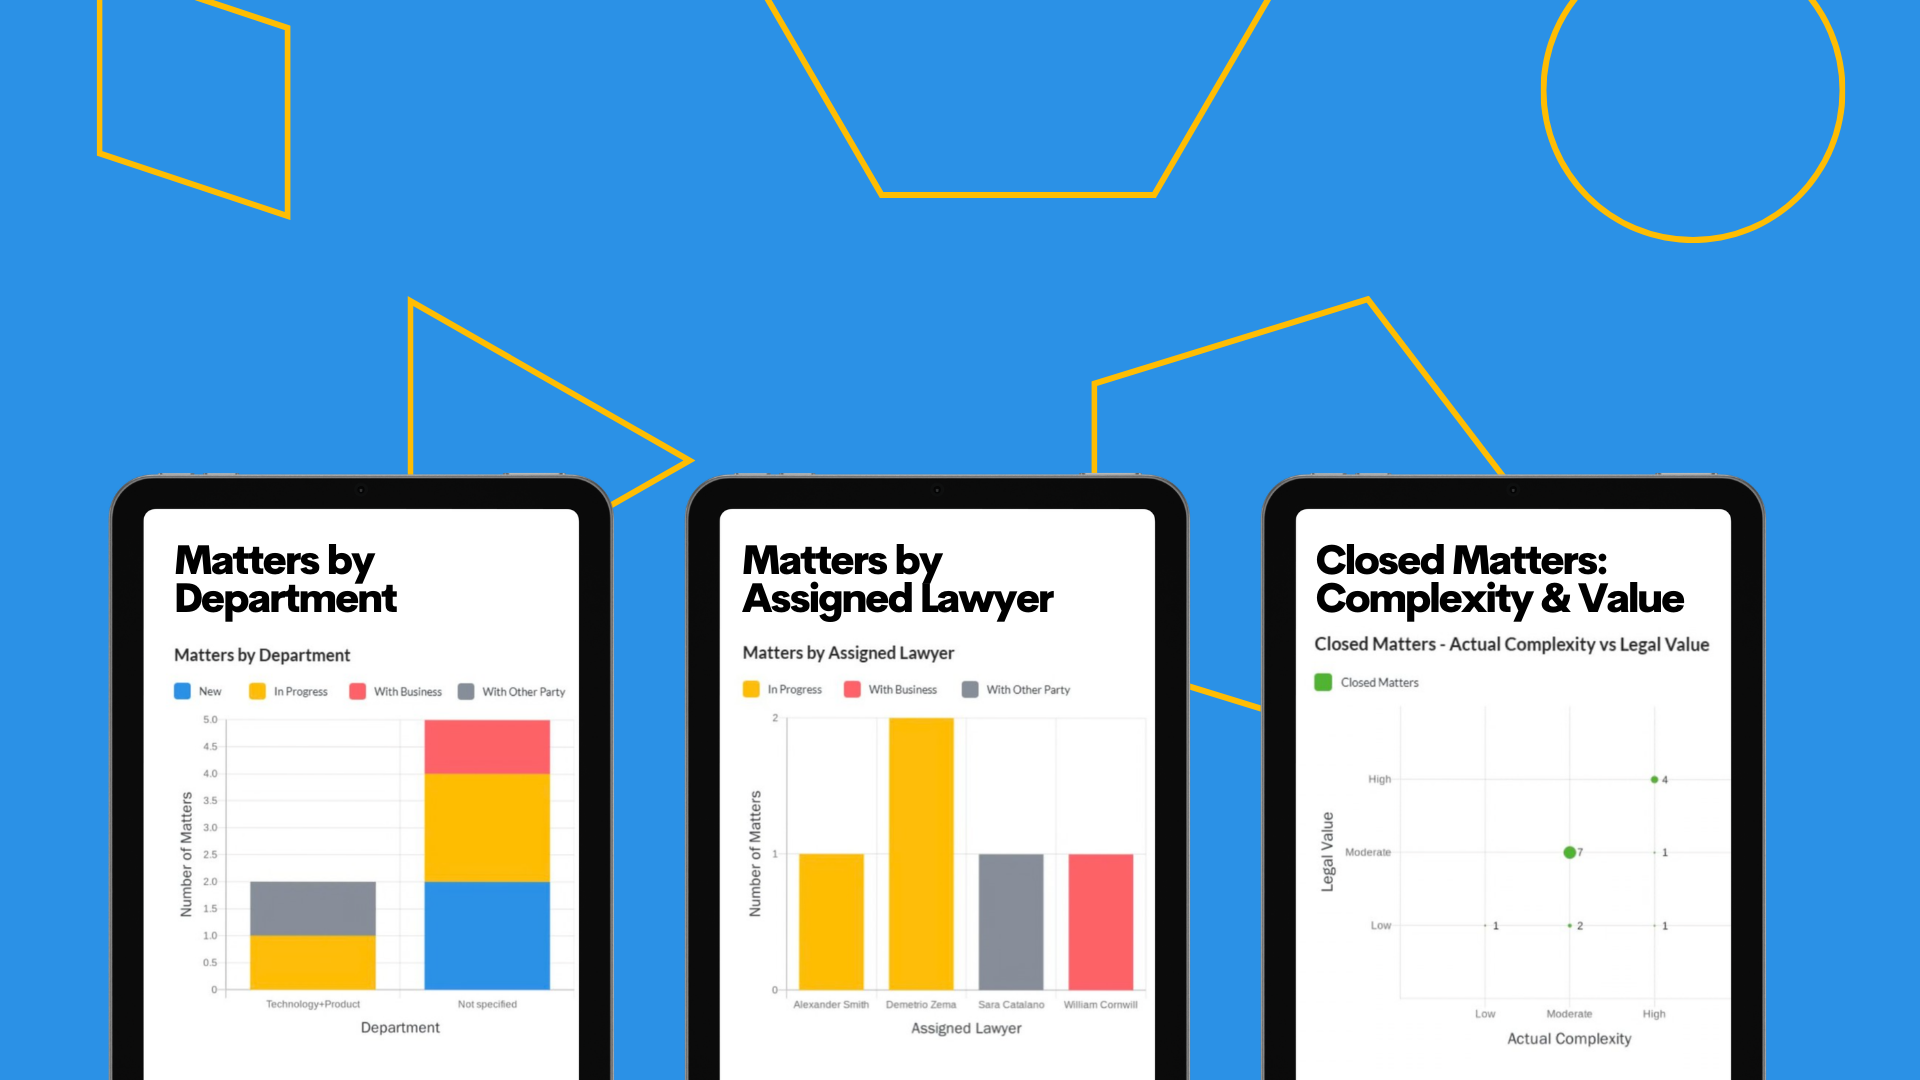
Each dashboard provides a different lens, but the real value comes from using them together. The Status of Matters dashboard shows what is active, the Matters at Risk dashboard highlights potential issues early and the Team Workload dashboard shows who owns the work and how capacity is being used. Combined, they give legal leaders a practical, real -time view of the function and support better decision making.
Setting Up Operational Dashboards
Operational dashboards can be built using tools your team already knows or by adopting new ones:
Excel or Google Sheets: Simple tables, conditional formatting, and charts provide instant visibility into matters, deadlines, and workload. Ideal for small teams or as a starting point.
Power BI or Tableau: For teams looking to automate, visualise trends, and combine multiple data sources, business intelligence tools provide interactive dashboards with real-time updates.
Integrated Legal Ops Platforms (like Cubed by Law Squared): These platforms combine matter tracking, risk flags, and workload data in one connected system, removing manual updates and giving teams real-time insights without extra effort.
The right approach depends on your team’s size, maturity and need for automation.
Building a Foundation for Outcome Focused Decisions
Consistent tracking of operational metrics gives legal teams clear visibility into what is urgent, what is delayed and where capacity sits. Over time, this data highlights patterns and sets the stage for tracking the next level of outcome-based metrics.
How Cubed by Law Squared Helps
Cubed by Law Squared brings these dashboards together in one place, giving in-house legal teams real time visibility into matters, risk and workload without relying on spreadsheets or manual tracking.
If you would like to see how these dashboards work in practice, book a demo of Cubed by Law Squared to explore how your team can gain visibility and manage capacity.